Does the organization scale?
In an organization I was working with many years ago there was a question looming. The department was undergoing a re-organization and the question was “Does it scale?” What was referred to was the organizational structure, or how the organizational boxes had been drawn on paper. But it was more a question of “How does it scale?” When I say looming it was mostly because the question that was being asked outright was “Where is my breaking point?”
First, yes it scales. Pretty much whatever it is, from an organizational perspective. As a matter of how it scales, usually via option A, B, C, D or E. But when we get to the question of breaking points… it got difficult to understand what they were trying to maximize. Essentially, we needed to figure out the constraint within the system that would hinder or make growth difficult. Ok, but why is that so bad then? Well, the language used to drive the re-organization, merely exemplified here, suggests a machine metaphor like what Fréderic Laloux talks about in his book Reinventing Organizations. The machine belongs on the orange level and suggests that people are merely cogs in a machine, if they break, we replace them. I am not going to dwell on this, and what I attempted was to shift the conversation by saying – there is no breaking point, but when does it stop making sense to try and scale from a financial/value creation point-of-view? I tried to do this by looking at what happens to the organization’s capability to deliver.
If we start with a not so uncommon scenario where we are working on 3 different programs of work in parallel A, B and C. A program consisting of multiple large-scale projects. For simplicity, let us assume all programs have 2 years left to run.

Imagine this is your reality and senior stakeholders, investors and the executive board wants you to start D. What do you say?
- Sure, what’s my budget? I imagine we will need 100 people to pull this off.
You cannot possibly recruit 100 people over night, so you borrow people from B and C because of the urgency to start this new idea.

You have now effectively delayed B and C by a year each. This is assuming there is no effect on A, which we know there will be according to Little’s Law which says:
L = λW
Where W is your Program cycle time, L is the number of Programs you run in parallel and λ is your average departure rate, the rate at which you finish Programs.
Which we can rewrite as follows:
W = L/λ
Without digging too deep, do you think it will be easier to deliver faster, i.e., reduce program cycle time, by doing fewer things in parallel or increasing your ability to finish stuff?
No matter your answer, what I have seen happen more often than not, is a mentality to “push” people to work harder on more things in parallel, thus believing the λ will increase. This might seem logical but when we have uncertainty in the system and we are dealing with unbounded work, increasing utilization will only lead to longer cycle times, i.e., a smaller λ.

This graph shows what happens to queue size when utilization approaches 100%, it goes to infinity. This is due to variability caused by uncertainty and the nature of unbounded work.
In manufacturing the aim is, and has always been, to reduce/remove variability. When you mass-produce something, you want the exact same result every time. This is how you can achieve quality at a large scale. This has been the goal for any empirical process control approach, especially Six Sigma or 6sigma. Where sigma depicts the variability and the six means you are in the sixth quantile of a normal distribution. Which means a yield rate of 99.99966%, or 3.4 defects per million.
So, what does this have to do with the graph? The key differentiator between manufacturing and software development is uncertainty. Variability caused by uncertainty inherent in complexity. In software development, and any other area where knowledge workers are involved, we never solve the exact same problem twice. Which inherently means we cannot reduce variability since every solution is unique, broadly speaking.
As humans we are inherently bad at understanding the effects of randomness as pointed out by both Daniel Kahneman in Thinking Fast and Slow as well as Nassim Nicolas Taleb in his books Black Swan, Antifragile and Fooled by Randomness.
If we take the classic flip of a coin. Heads means +1, Tails means -1 on the Y-axis. Imagine you start on 0,0 and do 1000 consecutive flips with every flip moving you one step forward on X-axis. How many times do you cross the 0-line?
Try to do this without glancing at the pictures to come.
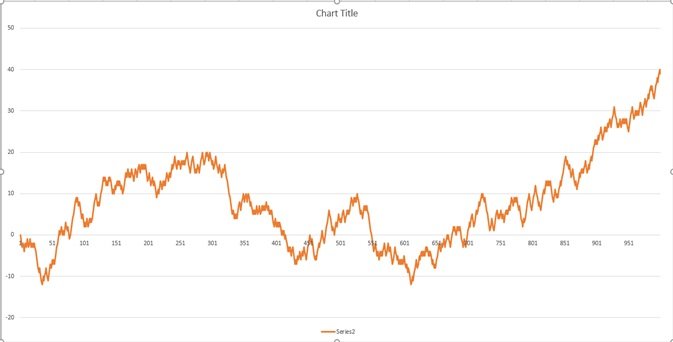
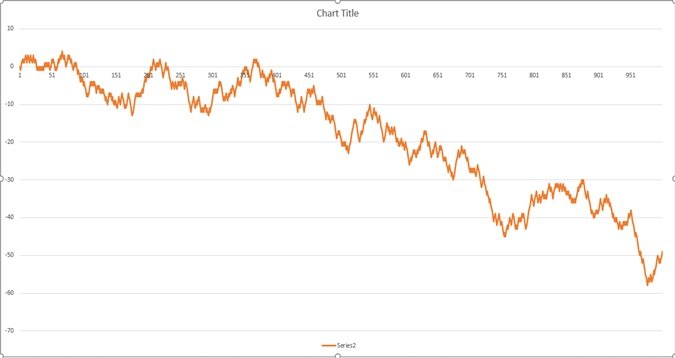
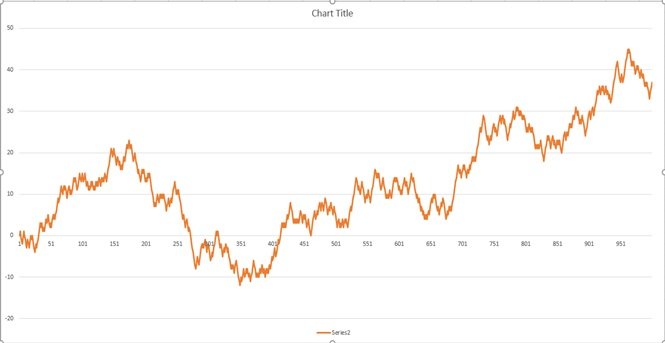
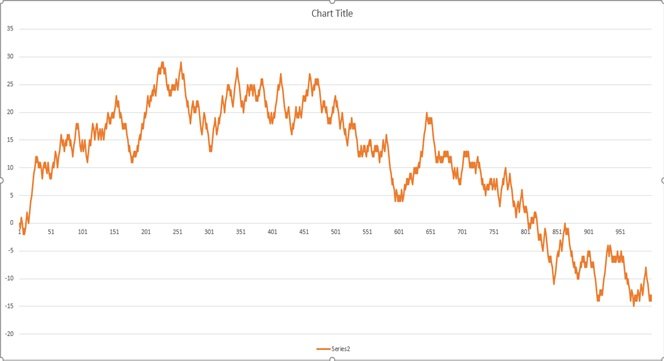
This is called a random walk, or sometimes referred to as the drunkard’s walk. This is well known to individuals with a background within mathematical statistics, signal processing and similar fields. Myself, having spent the majority of my learning journey at the university on just those topics got a spark in that area when I attended Donald Reinertsen’s masterclass in product development flow. He had a very good example that I will try to retell.
Imagine you’re out on town with your best friend, you’ve been to the pub and he/she have had a bit too much to drink. On your way home you walk past a convenience store that is open, you feel the need to pop in and get your friend something to nibble on and some water. You stop by a lamp post outside and give firm instructions to your friend not to go anywhere, stay within arm’s reach of the lamp post until you come back. When you come back outside your friend is nowhere to be seen. This because of the drunkard’s walk, taking one step in a random direction in order to keep balance, ending up anywhere but arm’s length from the lamp post. Now let’s move the hypothetical lamp post to the top of a building, with no safety rail. You do the same thing, leave your friend by the lamp post with clear instructions to stay. You go away for two minutes and come back to check. Where’s your friend now? Closer to the ledge most likely. What do you do? You move your friend to the lamp post in the middle again. You reset the system. You do this to counter the effects of variability. If you found your friend dangerously close to the edge you might even consider to reduce the time you spend away. You shorten the feedback loop to do smaller resets and stay well within the limits of the system. Now consider if you had 20 of your friends on the roof.
What are the effects of variability in your system? It is common in software development frameworks that you plan work in iterations, e.g., a 2-week period. After the time period has passed you evaluate the outcome and reset the plan. Essentially moving back to the lamp post or the ‘0’ on the Y-axis.
Unbounded work, what do we mean by that?
Have you ever heard anyone say - “it will take the time it takes”? Unbounded work is the kind of work that easily fills up the space you allow it to take. You could view it as a gas canister being filled up. Until the point where it reaches the pressure limit, the gas will occupy the same amount of space.
Or it is like when you say you are going to clean your home for an hour, and it takes an hour. Or when you say you will clean your home for a day, and it takes a day.
Recommended Strategy
In short, the recommended strategy to increase your software organization’s capability to deliver value is to first focus on doing the right thing, i.e., outcome, or effectiveness. Once you have maximized your effectiveness you go on to increase the number of things you do, i.e., output, or efficiency.